Do you want to improve your website speed and performance? If yes, then a speed test tool will be helpful for you.
Many professional tools are available online that give you insight into your website.
Each tool does different jobs and has a different cost; not every tool is for you. So many questions will eat your brain out when you are looking for the best tool to optimize your website.
To make things easy for you, I am discussing a popular speed test tool GTmetrix.
Today, you will learn how to use GTmetrix to optimize your website speed and performance.
What is GTmetrix?
.jpg) |
| GTmetrix How to Optimize Your Website with Speed Test Tool: eAskme |
GTmetix is a popular free and premium speed test tool to check the speed of your website, blog, or webpage. It was launched in 2009, and since then, it has been helping webmasters.
GTmetrix report will display all the errors and suggestions you need to fix the errors on your website or page.
You can check load time, size, number of requests, performance score, structure, LCP, TBT, CLS, etc.
Every webmaster, blogger, SEO expert, developer, etc., can use the GTmetrix tool to optimize the speed of his website or blog.
GTmetrix Faqs:
- Developed by Carbon 60.
- 900 million+ pages tested every day.
- 1,000,000+ registered users.
- 5,000+ enterprise accounts.
- 104 job servers in 22 locations.
How to Use GTmetrix?
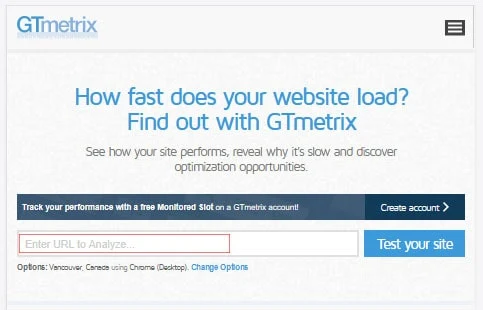
You can access the GTmetrix website.
For a starter, you can use GTmetrix for free even without registration. You only need a GTmetrix login to change browser type or edit location.
Follow these simple steps to check your website on GTmetrix:
- Go to GTmetrix.com
- Type or website URL in the “Enter URL to Analyze” box.
- Hit the “Test Your Site” button.
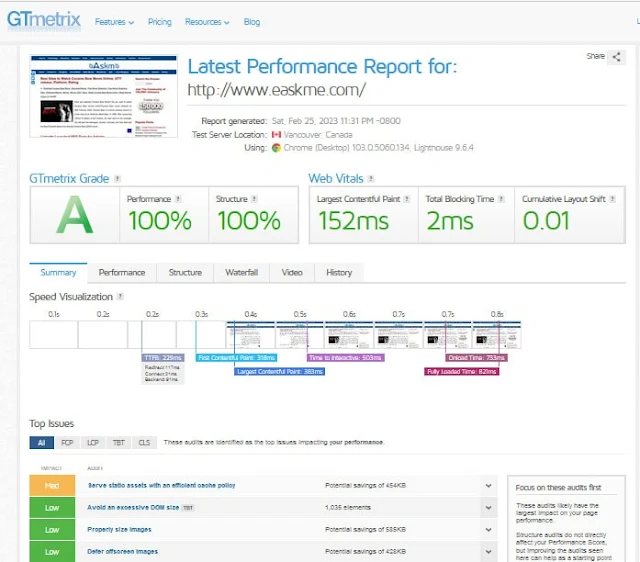
- Within seconds GTmetrix report will display your website’s latest performance report.
You can review metrics to understand what is wrong and where.
GTmetrix report of your website will display the following:
What is GTmetrix Measurement?
GTmetrix Measurement is important to understand your website issues and fixes.
GTmetrix Grade:
GTmetrix Grade is the score of the overall performance of your website or blog. GTmetrix Grade, including performance and structure score.
Your website GTmetrix grades comes from the complex calculations of architecture and page speed.
Websites with clean structure and fast loading get better grades than poorly structured websites.
Performance Score:
You can compare your GTmetrix performance score with the Lighthouse performance score.
It will help you better understand the metrics and their impact.
Structure:
GTmetrix structure score is based on GTmetrix’s assessment algorithm, which performs audits with lighthouse assessments.
It shows if your site structure is good or bad.
GTmetrix Web Vitals:
GTmetrix also displays your core web vitals score. Web Vitals, including LCP, TBT, and CLS.
- First Contentful Paint (FCP)
- Largest Contentful Paint (LCP)
- Total Blocking Time (TBT)
- Cumulative Layout Shift (CLS)
You can also check levels to understand what you should fix first.
Largest Contentful Paint (LCP) :
Your website LCP should be less than or equal to 1.2 seconds.
Total Blocking Time (TBT):
TBT of your website displays the total time that prevents users from engaging with your website.
Cumulative Layout Shift (CLS):
Cumulative Layout Shift checks the unusual shift in layout during page load. It shows the stability of your website structure.You will find 6 tabs to check your website performance in detail: Summary, Performance, Structure, Waterfall, Video, and History.
GTmetrix Speed visualization is an easy way to see how your website looks when it loads. It also displays important metrics.
You will find issues in the structure tab that must be fixed quickly.
Now you understand what is available in GTmetrix Summary Tab.
Let’s discuss the other 5 important tabs in GTmetrix.
GTmetrix Performance Tab:
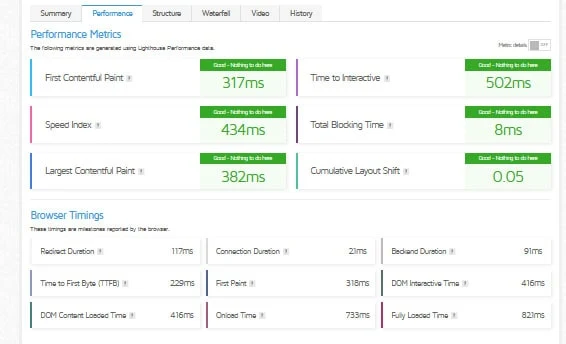
GTmetrix performance tab display metrics that impact your website performance, such as:
- FCP
- Time to Interactive
- Speed Index
- TBT
- LCP
- CLS
You will also see your website's “Browser Timings” or webpage.
In the “Browser Timings” section, you can check the following:
- Redirect duration
- Connection Duration
- Backend Duration
- Time to First Byte (TTFB)
- First Paint
- DOM Interactive Time
- DOM Content Loaded Time
- Onload Time
- Fully Loaded Time
GTmetrix Structure Tab:
The GTmetrix Structure tab is where you should fix your website or blog speed.
You will find suggestions to fix speed issues and core web vital issues. You can see audits report and impact ratings.
Click on the down arrow of the issue to know how you can fix it.
You may find a lot of technical solutions here. If you cannot understand technical solutions, click “Learn How to Improve This,” and you will find guides to fix your website. You will also learn what not to do and how things work for you.
GTmetrix Waterfall Tab:
You will not see a real waterfall, but you will see the flow of your website.
And that is quite important for you.
 |
| GTmetrix Waterfall Tab: eAskme |
You will find which resources consume more time to load and affix.
Fixing many such issues using a CDN service like Cloudflare is easy.
GTmetrix Video tab:
In the GTmetrix video tab, you can record a video of webpage loading and find out different issues.
You can only do that after signing up and logging in to GTmetrix.
GTmetrix History Tab:
The GTmetrix history tab displays the changes on your website over time.
It is helpful to find out if your changes are bringing a positive impact.
Conclusion:
GTmetrix speed test tool that offers suggestions to improve your website performance and speed.
It is easy to find errors on your website that impact speed and user experience. It also affects your search engine ranking.
GTmetrix is the tool that you should use to optimize your website speed and search ranking.
If you still have any question, do share via comments.
Don’t forget to share it with your friends and family.
Why?
Because, Sharing is Caring!
Don't forget to like us FB and join the eAskme newsletter to stay tuned with us.
Other handpicked guides for you;


